The Enhancement Efficiency page is a powerful simulation and calculation tool in MapleToolkits. It contains four main tabs: StarForce, Potential, Flame, and X Billions.
The first three tabs are designed to simulate specific MapleStory equipment enhancement systems (StarForce, Potential, and Flame), while the fourth tab provides optimized prioritization and ranking based on the results from the first three tabs.
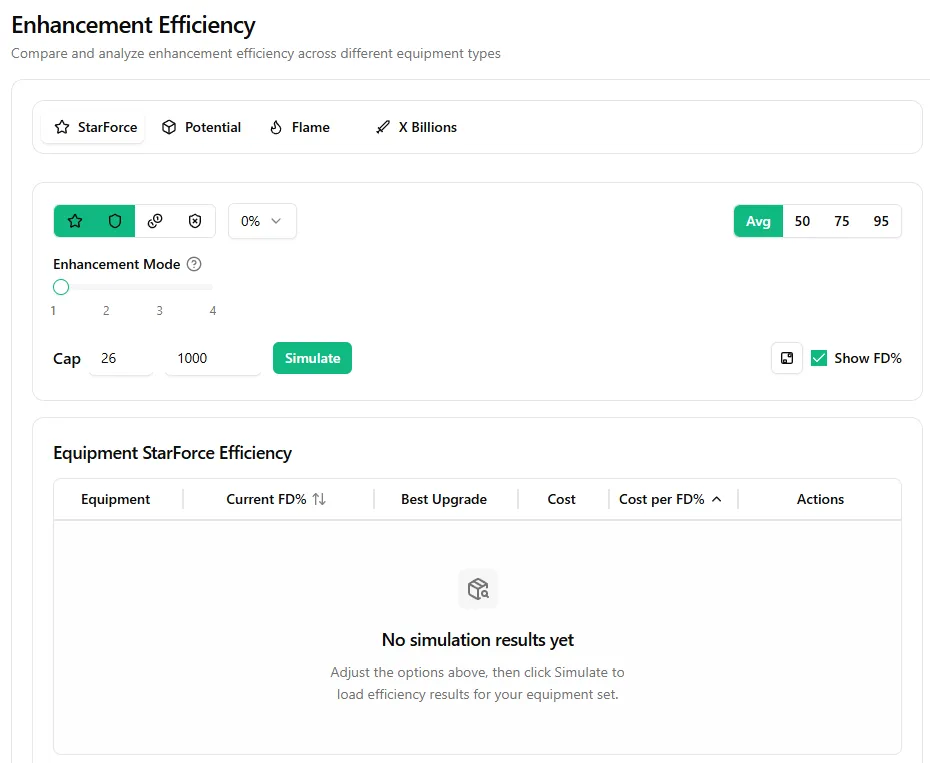 Figure 1: Default view of the Enhancement Efficiency page.
1. StarForce
The StarForce tab simulates the StarForce enhancement process for your equipment. It is divided into an Operation Area (top) and a Results Area (bottom).
1.1 Operation Area
The left side of the operation area contains the simulation configuration settings:
- Event Toggles (Top Left): Toggle events such as Star Catching, Safe Guard, 30% Off Mesos, and 30% Off Destruction (Up to 21 stars) to simulate different active StarForce event scenarios.
- Enhancement Mode: Introduced in version V269, this slider allows you to select between 4 tiers of enhancement modes. Each tier has different success rates and costs (click the question mark icon next to the label for detailed explanations of each tier).
- Simulation Settings: Set the enhancement upper limit Cap (defaults to 26), the number of simulation iterations, and click the Simulate button.
The right side of the operation area contains display and rendering settings:
- Percentile Selector: Choose which percentile simulation data to display (Average, 50th, 75th, or 95th).
- Show Enhancements: Determines whether to show current equipment’s star count information directly on the equipment icon (similar to the Equipment page).
- Show FD%: Toggle whether the simulation results display in FD% (Final Damage percentage, default) or in Main Stats.
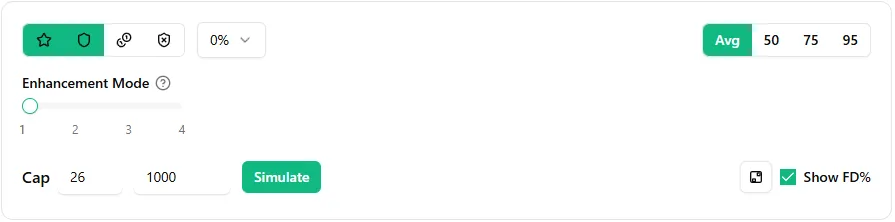 Figure 2: StarForce operation area configuration panel.
1.2 Results Area
After clicking Simulate and waiting for the simulation to complete, the results table will load below:
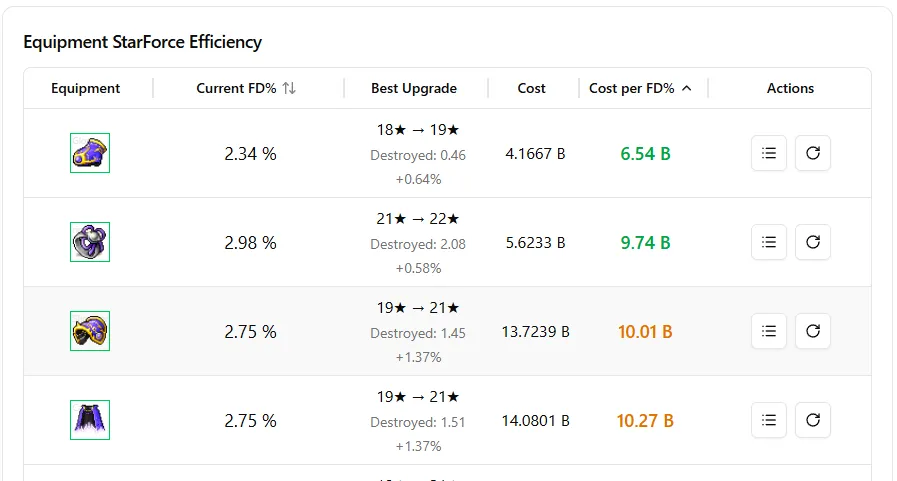 Figure 3: StarForce simulation results table.
The table is sorted in ascending order of Cost per FD% / Stat for each individual equipment slot. Across all slots, the best-value upgrade option for each piece of equipment is consolidated and sorted in ascending order. The table contains the following columns:
- Equipment: The equipment slot being simulated.
- Current FD%: The Final Damage percentage equivalent of the current StarForce attributes configured for this gear on the Equipment page.
- Best Upgrade: The recommended target star level for maximum efficiency, including the additional stats converted to FD%.
- Cost: The estimated meso cost to reach the target upgrade.
- Cost per FD%: The estimated cost divided by the gained FD% (indicating the cost efficiency of the upgrade path).
- Actions:
- View All (List Icon): Opens a detailed modal displaying the cost, destruction rate, FD% gain, and cost per FD% for all potential target star levels.
- Recalculate Efficiency (Refresh Icon): Triggers a re-simulation specifically for the selected equipment. This is incredibly useful for on-the-fly updates; for example, you can keep the Equipment page open in another window, update the equipment slot after a successful in-game enhancement, and click this button to recalculate and update the re-ordered list to decide your next gear upgrade path.
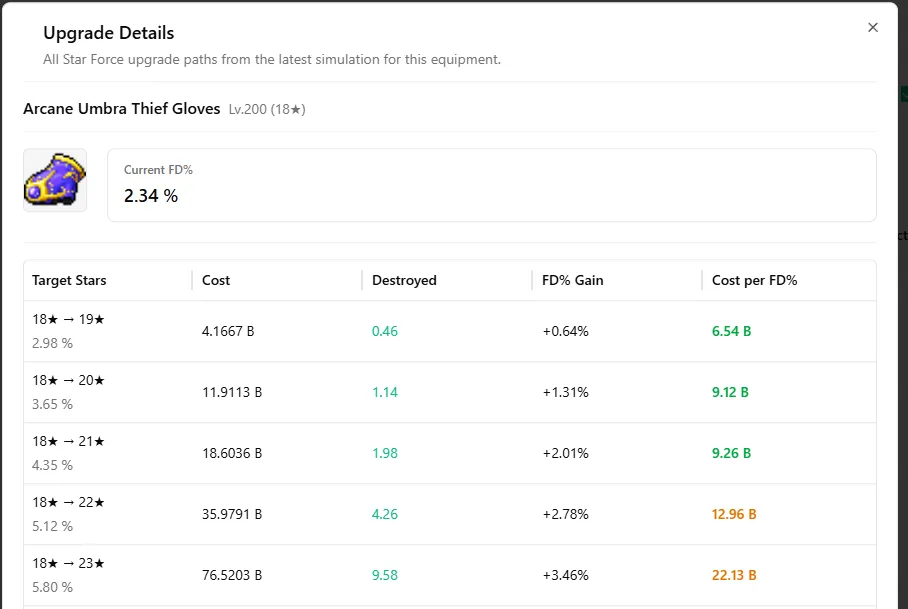 Figure 4: Detailed view all upgrade paths modal.
2. Potential and Flame
The Potential and Flame tabs operate similarly to the StarForce tab. They are tailored to simulate cube potential rolling and rebirth flame rolling respectively, helping you analyze the expected cost and efficiency (Cost per FD% or Stat gain) for upgrading your gear’s potentials and bonus stats.
3. X Billions
The X Billions tab allows you to set a fixed budget (in billions of mesos) and automatically calculates the most optimal enhancement path across all your gear.
IMPORTANT: This tab can only be used after you have run a simulation on at least one of the first three tabs (StarForce, Potential, or Flame) to populate the source data.
Note that the percentile selector (Avg / 50 / 75 / 95) on the top right plays a critical role here. Unlike the first three tabs where it only changes the display, in the X Billions tab, it determines which percentile dataset is actually used in the calculation algorithm to compute the optimal path.
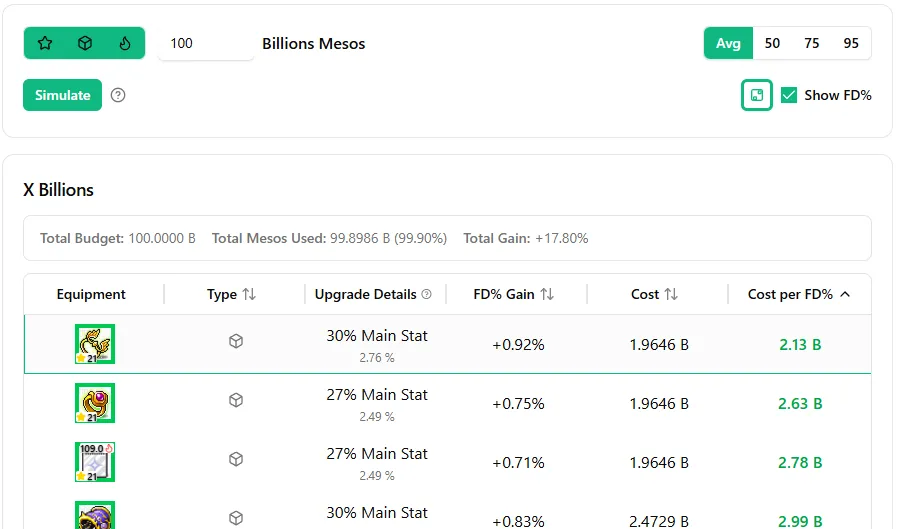 Figure 5: Preview of the X Billions tab showing the optimal path simulation results.
Access the Live Tool
Access the Live Enhancement Dashboard
Guide details, assumptions, and verification
Supported scope: MapleStory Global-style enhancement settings. Last reviewed: July 20, 2026. Event toggles and enhancement rules must match the game version being simulated.
Method: The tool estimates expected upgrade cost and compares the estimated Final Damage or stat gain against the supplied equipment profile. Simulation percentiles describe the selected simulated distribution; they are not a promise that an individual enhancement attempt will cost that amount.
Worked example: For a 17-star item, run one simulation with event toggles disabled and one with only the event you expect to use enabled. Compare the same percentile and target cap in both runs. If the lower cost changes the recommended target, retain the event assumption in your upgrade notes rather than treating it as an always-available baseline.
Troubleshooting: Re-run a simulation after changing the current item, cap, event state, or character profile. Do not compare rows produced from different percentile or event settings.
Sources and updates: Validate event and system changes against official MapleStory notices. Update history: July 20, 2026 — added methodology, example, and risk limits.